
How does OpenTSDB work?
OpenTSDB consists of a
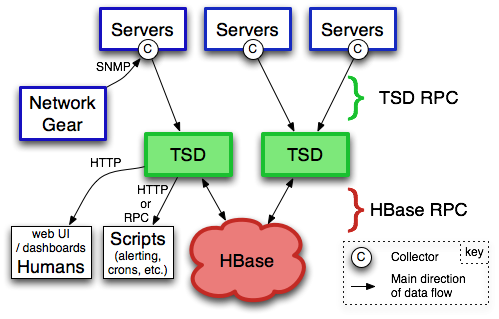
Time Series Daemon
(TSD) as well as set of command line utilities. Interaction with OpenTSDB is
primarily achieved by running one or more of the TSDs. Each TSD is independent.
There is no master, no shared state so you can run as many TSDs as required to handle any
load you throw at it. Each TSD uses the open source database
HBase or hosted Google Bigtable service to store and
retrieve time-series data.
The data schema is highly optimized for fast aggregations of similar time series to
minimize storage space. Users of the TSD never need to access the underlying store directly.
You can communicate with the TSD via a simple telnet-style
protocol, an HTTP API or a simple built-in GUI. All communications happen on the
same port (the TSD figures out the protocol of the client by looking at the first
few bytes it receives).
Writing
The first step in using OpenTSDB is to send time series data to the TSDs. A number of
tools exist to pull data from various
sources into OpenTSDB. If you can't find a tool for your needs, you may need to write
scripts that collect data from your systems (e.g.
by reading interesting metrics from
/proc on Linux, collecting
counters from your network gear via SNMP, or other interesting data from your
applications, via JMX for instance for Java applications) and push data points
to one of the TSDs periodically.
StumbleUpon wrote a Python framework
called
tcollector
that is used to collect
thousand of metrics from Linux 2.6, Apache's HTTPd, MySQL, HBase, memcached,
Varnish and more. This low-impact framework includes a number useful collectors
and the community is constantly providing more. Alternative frameworks with OpenTSDB
support include Collectd, Statsd and the Coda Hale metrics emitter..
In OpenTSDB, a time series data point consists of:
- A metric name.
- A UNIX timestamp (seconds or millisecinds since
Epoch).
- A value (64 bit integer or single-precision floating point value), a JSON
formatted event or a histogram/digest.
- A set of tags (key-value pairs) that describe the time series the point belongs to.
Tags allow you to separate similar data points from different sources or
related entities, so you can easily graph them individually or in groups.
One common use case for tags consists in annotating data points with the
name of the machine that produced it as well as name of the cluster or
pool the machine belongs to. This allows you to easily make dashboards
that show the state of your service on a per-server basis as well as
dashboards that show an aggregated state across logical pools of servers.
mysql.bytes_received 1287333217 327810227706 schema=foo host=db1
mysql.bytes_sent 1287333217 6604859181710 schema=foo host=db1
mysql.bytes_received 1287333232 327812421706 schema=foo host=db1
mysql.bytes_sent 1287333232 6604901075387 schema=foo host=db1
mysql.bytes_received 1287333321 340899533915 schema=foo host=db2
mysql.bytes_sent 1287333321 5506469130707 schema=foo host=db2
This examples contains 6 data points that belong to 4 different time series.
Each different combination of metric and tags makes up a different time
series. All of the 4 time series are for one of two metrics
mysql.bytes_received or
mysql.bytes_sent.
A data point must have at least one tag and every time series for a metric
should have the same number of tags. It is not recommended to have
more than 6-7 tags per data point, as the cost associated with storing
new data points quickly becomes dominated by the number of tags beyond
that point.
With the tags in the example above, it will be easy to create graphs and
dashboards that show the network activity of MySQL on a per host and/or per
schema basis. New to OpenTSDB 2.0 is the ability to store non-numeric annotations
along with data points for tracking meta-data, quality metrics or other types
of information.
Reading
Time series data is usually consumed in the format of a line graph. Thus OpenTSDB
offers a built-in, simple user interface for selecting one or more metrics and tags
to generate a graph as an image. Alternatively an HTTP API is available to tie
OpenTSDB into external systems such as monitoring frameworks, dashboards, statistics
packages or automation tools.
Take a look at the resources
page for tools contributed by the community for working with OpenTSDB.

